

Four small tables of numbers produce the same averages, the same trend line and the same correlation. Plot them, and you get four completely different stories.
That is the trick a statistician named Francis Anscombe pulled off in 1973. Each of his four datasets holds just eleven pairs of numbers, and the standard summary figures treat them as near twins. Your eyes do not.
The impression he wanted to break
Anscombe had a target in mind. Many statisticians of his day believed that “numerical calculations are exact, but graphs are rough”. In other words, the formula is the serious part, and the chart is just decoration.
He built the quartet to show that the reverse can be true. A chart can reveal what a calculation quietly hides. He also insisted that “a computer should make both calculations and graphs”.
Four pictures, one set of summary numbers
Here is what happens when you actually draw them.
The first set looks like a textbook example. The points form a tidy, roughly straight cloud, and a simple linear relationship fits well.
The second set is a smooth curve. The two variables are clearly linked, but not in a straight line, so a correlation coefficient is simply the wrong tool to describe it.
The third set is a straight line with one rebel. A single outlier drags the calculated trend line away from the other points. Without it, the correlation would be a perfect 1. With it, the figure falls to 0.816.
The fourth set is the most unsettling. Ten of the eleven points show no relationship between the variables. Then one high-leverage point sits apart from the rest, and that single point is enough to produce a high correlation on its own.
Why a single number can lie
An average, a spread or a correlation squeezes a whole dataset into one figure. That is useful, but squeezing always throws something away. The quartet shows how much can disappear: a curve, an outlier, one point doing all the work.
It is the same warning behind every famous false correlation. A tidy number says “these things move together”, but it cannot say why, or whether one stray point is faking the whole thing.
Nobody knows how he made them
Here is the odd part. It is not known how Anscombe created his datasets. He left the finished tables, and the method stayed with him. Anscombe, born in Hove in 1918, went on to Princeton in 1956 and became the founding chairman of the statistics department at Yale in 1963.
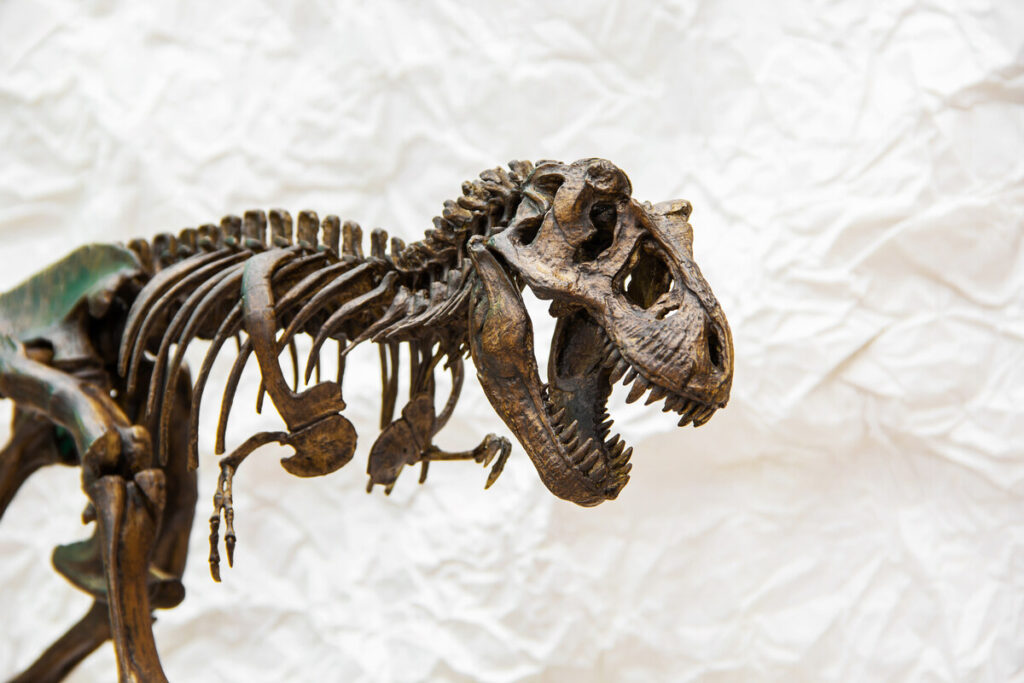
Others tried to reverse-engineer the trick. In 2016, Alberto Cairo built a dataset whose points trace the outline of a Tyrannosaurus. Then Justin Matejka and George Fitzmaurice at Autodesk expanded it into the Datasaurus dozen, thirteen datasets that share nearly identical summary statistics to two decimal places.
Unlike Anscombe, they explained their recipe. They used simulated annealing: small, random, biased nudges to each point, repeated 200,000 times per shape, steering the cloud toward a target picture while keeping the statistics frozen.
Draw it first
The lesson has not aged. Before trusting a trend, a correlation or a forecast, plot the raw points. It takes seconds, and it can show you a curve, an outlier or a dinosaur that the summary never mentioned. The same instinct is why a single well-drawn chart can say more than a page of figures.